A new Database
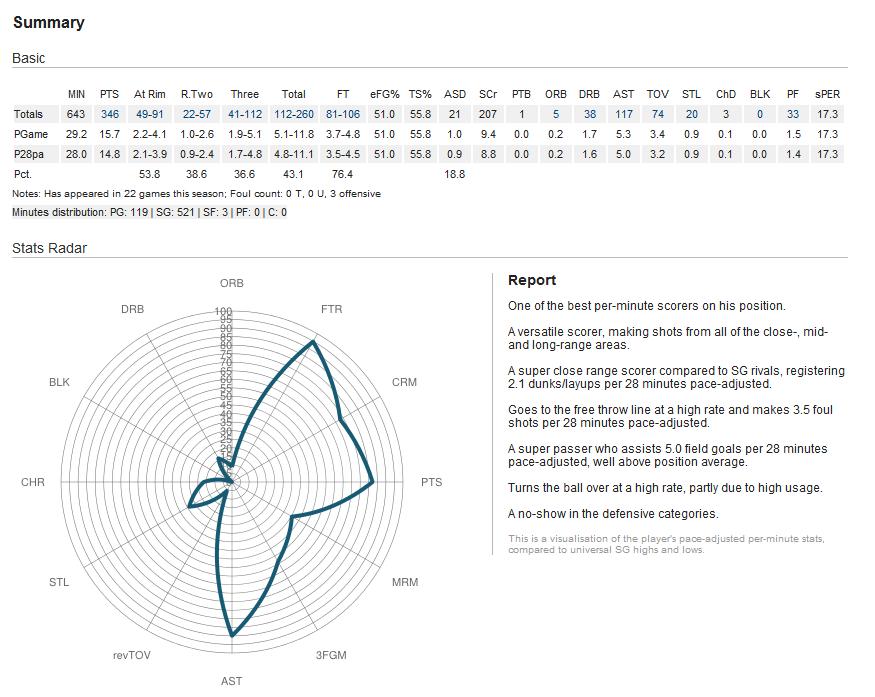
- Understand what statistics mean in a positional context: The visualisation below displays the player’s pace-adjusted per minute stats in a positional context. Position-adjustment isn’t error-free – getting the positions right is a challenge in the first place – but it helps understanding areas of the game where statistics correlate strongly with height, such as rebounding and shot blocking.
Per-minute scoring, too, is historically better on the center position in the Euroleague rather than the perimeter positions, something that you also notice when comparing top backcourt scorers with top interior scorers in the player head-to-head tool.
Any idea who he is? Test yourself.
The Stats Radar is more of a skill chart than an impact chart, though. Blocks and charges, for examples, are rare events for backcourt players, so only few of those are needed to register a good rating among position rivals. The numbers are all adjusted from zero to 100 percent to fit the graph, but they differ in actual on-court impact.
- Understand where shots are coming from: Euroleague play-by-play distinguishes between Dunks, Lay Ups, Two Pointers, Three Pointers and Free Throws as scoring categories. The league averages of (1) Dunk/Lay up (61.2 percent) and (2) Two Pointers (38.6 percent) are similar to Hoopdata‘s (1) At Rim (62-64 percent in recent years) and (2) Shots from three to 23 feet (38 to 41 percent) and German BBL numbers, hence there appears to be some validity to the numbers. Just like in the Hoopdata database, the term “mid range” does not fully cover the “Two Pointer” in Euroleague play-by-play, however, since “Two Pointers” can also be non-dunk/lay up twos from relatively close inside.
There is one noticeable exception: The Maccabi Tel Aviv scorekeepers appear to handle the distinction between Dunk/Lay Up and Two Pointer differently, with a clear emphasis on the latter, which is noticeable not only for Maccabi stats, but also for visiting teams, compared to their rest-of-the-season data.
Shot data can be viewed on the player shot creation page or in the league-wide shot creation table.
- Understand who creates for himself, and who doesn’t: Shot creation is a field left untapped by mainstream statistics. Which is a shame, because it tells us a lot about a player’s scoring game without even watching a single minute of action. This way we understand Kostas Papanikolaou’s three point shooting is entirely of the catch-and-shoot type, having 31 of 31 made three pointers created by an assist, whereas Marcus Williams took three quarters of his made three point shots off the dribble.

We also understand that Zoran Planinic leads the league in unassisted field goals plus assists (per 28 p.a.) just ahead of Vassilis Spanoulis.
Knowing who creates shots is massively important, since a potential assist drastically improves scoring percentages from all areas. - Understand how a player affects teammate performance: Oncourt/offcourt statistics are indicative only in extreme examples. All Olympiakos players except for Pero Antic shoot better from the field when Vassilis Spanoulis is on the floor with them, compared to off the floor.
Team effective field goal percentage improves by eight percentage points when Spanoulis is on the floor, offensive rating by 13 points per 100 possessions. - Understand how a player performs on different positions: Every single lineup that has hit the floor this season is sorted by position. Again, this leaves room for error, but we believe we got it pretty close to the real deal.
Compare how Felipe Reyes performs as a power forward, and as a center. - Understand what time during a game a player appears, and how he performs minute-by-minute: Jordan Farmar is 19 for 31 from the field in the last five minutes of regulation. He also likes the opening phase, standing at 15 for 22 from the field in the first three minutes of the game.
The first three minutes of the game is when Jaycee Carroll is still warming the bench. Carroll enters games towards the end of the first and towards the end of the third quarter.
- Understand how a player performs by quarter, while trailing or in the lead, and home versus away: Milos Teodosic is said to go bonkers launching long range shots when his team is trailing. The stats don’t really support that.
- Find out about the individual statistics of position matchups: Lineup sorting is likely far more accurate on the tall positions rather than on the small positions. If you don’t think Spanoulis is guarding Navarro in a Sada/Navarro backcourt when playing alongside Mantzaris or Law, ignore the matchup data. But position turnover is far less especially between the three, four and five. If you want to find out how Mirza Begic defended opposition centers like Sofoklis Schortsanitis, this may be for you.
Or the combined stats of Pete Mickeal’s small forward opponents, who is one of the leading candidates for Defensive Player of the Year? Just 37.2 eFG% and 40.7 TS%.
In any way, basketball is not a game of isolated matchups, so handle this data with care. In cases like Schortsanitis, who is exclusively a lowpost player, it may hold some value. - Find out what games a player appeared on a certain position, and what lineups they were: Want to find out how many games Emir Preldzic was used as a power forward, how many minutes and what lineups? Then this is what you are looking for.
- Go deeper into lineup data: Lineup data is a jungle. So McCalebb-Sato-Preldzic-Karaman-Batiste are 29-27 in 11 minutes of play. What opponents was that against and how did they perform game-by-game? This page has a list of games, minutes and performance stats, as well as a list of opposition lineups and individual stats.
- Understand what teams do and don’t do well: Just as player stats, team stats can be well displayed in a radar chart, using universal highs/lows as category boundaries. A steal percentage of 7.1 is all well, but how does it compare in a league-wide context? A table may help you, but in the below chart you have it all summed up.

- Check what your team’s most used and most successful lineups were. And get details on who they were up against.
- Understand what positions teams create their shots from: And how it compares to league average.
The team below gets a significant part of its shot creation from shooting guard, but only little from point guard and below average from small forward.

- Understand how teams shoot based on the event prior to the shot: Maccabi do exceptionally well in possessions where the shot follows a steal or a defensive rebound, hence they are likely one of the league’s top transition offenses.
CSKA Moscow and FC Barcelona Regal, meanwhile, shoot 56.3 and 56.4 eFG%, respectively, in possessions started by an inbounds pass. Great half court offense that is. - Find out who leads the league in technical fouls (it’s Nocioni) and offensive fouls (it’s Lasme and Zirbes).
- For single games, check when players appeared and on what position, and how the score developed: Against Chalon, Deon Thompson started the first eight minutes on power forward but only returned on center, as coach Obradovic went small down the stretch. That, and more, is what the game chart tells you.

Here’s the full list of games.
- Get further single game data: A Game MVP selection based on an advanced index rating, lineup data, an advanced games stats versus season stats comparison, a personal on-court boxscore which only counts actions that took place while a selected player was on the floor, as well as quarter-by-quarter boxscores.
- And all sorts of league comparison tables, such as advanced stats by position, miscellaneous team stats like timeouts, substitutions, et cetera.
If you find something suspicious please send feedback through this form, or use the comments section below.
-
Žarko Ajdinović